Debugging and Monitoring Applications > Using the NetConnection Debugger > NetConnection Debugger user interface
Debugging and Monitoring Applications > Using the NetConnection Debugger > NetConnection Debugger user interface |
NetConnection Debugger user interface
The NetConnection Debugger user interface contains the event display. To customize the debugger, use the Filters menu and the Preferences menu. The following figure shows the debugger user interface:
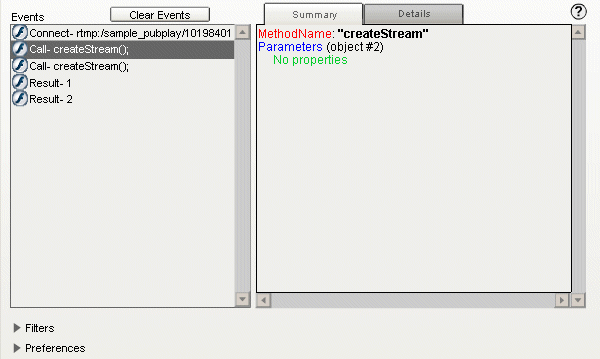
This window displays the following information:
Events shows a list of individual debug events. Each debug event contains an icon that represents the debug event source, the type of debug event, and a summary description of the event.
Summary panel shows a brief version of the debugging information for the selected debug event.
Details panel shows detailed debugging information for the selected debug event. Colors and punctuation marks are used to distinguish types of debugging information displayed.
The following colors and information are supported.
Red: property names |
|
Blue: property objects |
|
Black: property values |
|
Green: debugger error messages |
Property values use punctuation marks to convey data types. The following data types are supported:
Strings: double quotation marks ("string") |
|
Numbers: no special formatting |
|
Numbered arrays: brackets around array indexes (array[1]) |
|
Other types: string representation followed by type name in italicized parentheses, such as |
![]()