Managing the Server > Using the Administration Console > Viewing server diagnostics
Managing the Server > Using the Administration Console > Viewing server diagnostics |
Viewing server diagnostics
To view information about the server's responsiveness, the amount of time the server has been running, and the applications that are connected to the server, you use the Diagnostics panel. (To display the panel, see Using the Administration Console.)
The Diagnostics panel includes the following items:
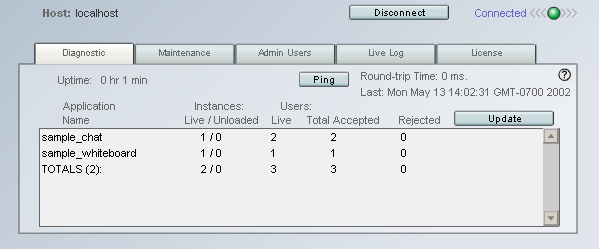
Uptime indicates how long the server has been running continuously and is updated once per minute. The uptime information is not available to virtual host administrators.
Ping lets you verify that the server is running and view its responsiveness in milliseconds.
Update allows you to get current information about the application instances that are running on the server. The name of each application is displayed, along with the number of instances of the application that have been created on or unloaded from the server, the number of users that are connected, and the total number of connections that have been accepted and rejected for each application. If you are connected as a virtual host administrator, Update displays information only for the virtual host you are connected to.
An application may have more than one instance if its clients connect to the server by using different application instance parameters within their ActionScript NetConnection calls. (For more information on the NetConnection object, see the Client-Side Communication ActionScript Dictionary.)
![]()